Case study - PIMCO
A central location to serve available data to our clients.
PIMCO is a global leader in active fixed income with deep expertise across public and private markets. their extensive resources, global presence and time-tested investment process are designed to help provide their clients with an edge as they pursue their long-term goals.
Summary
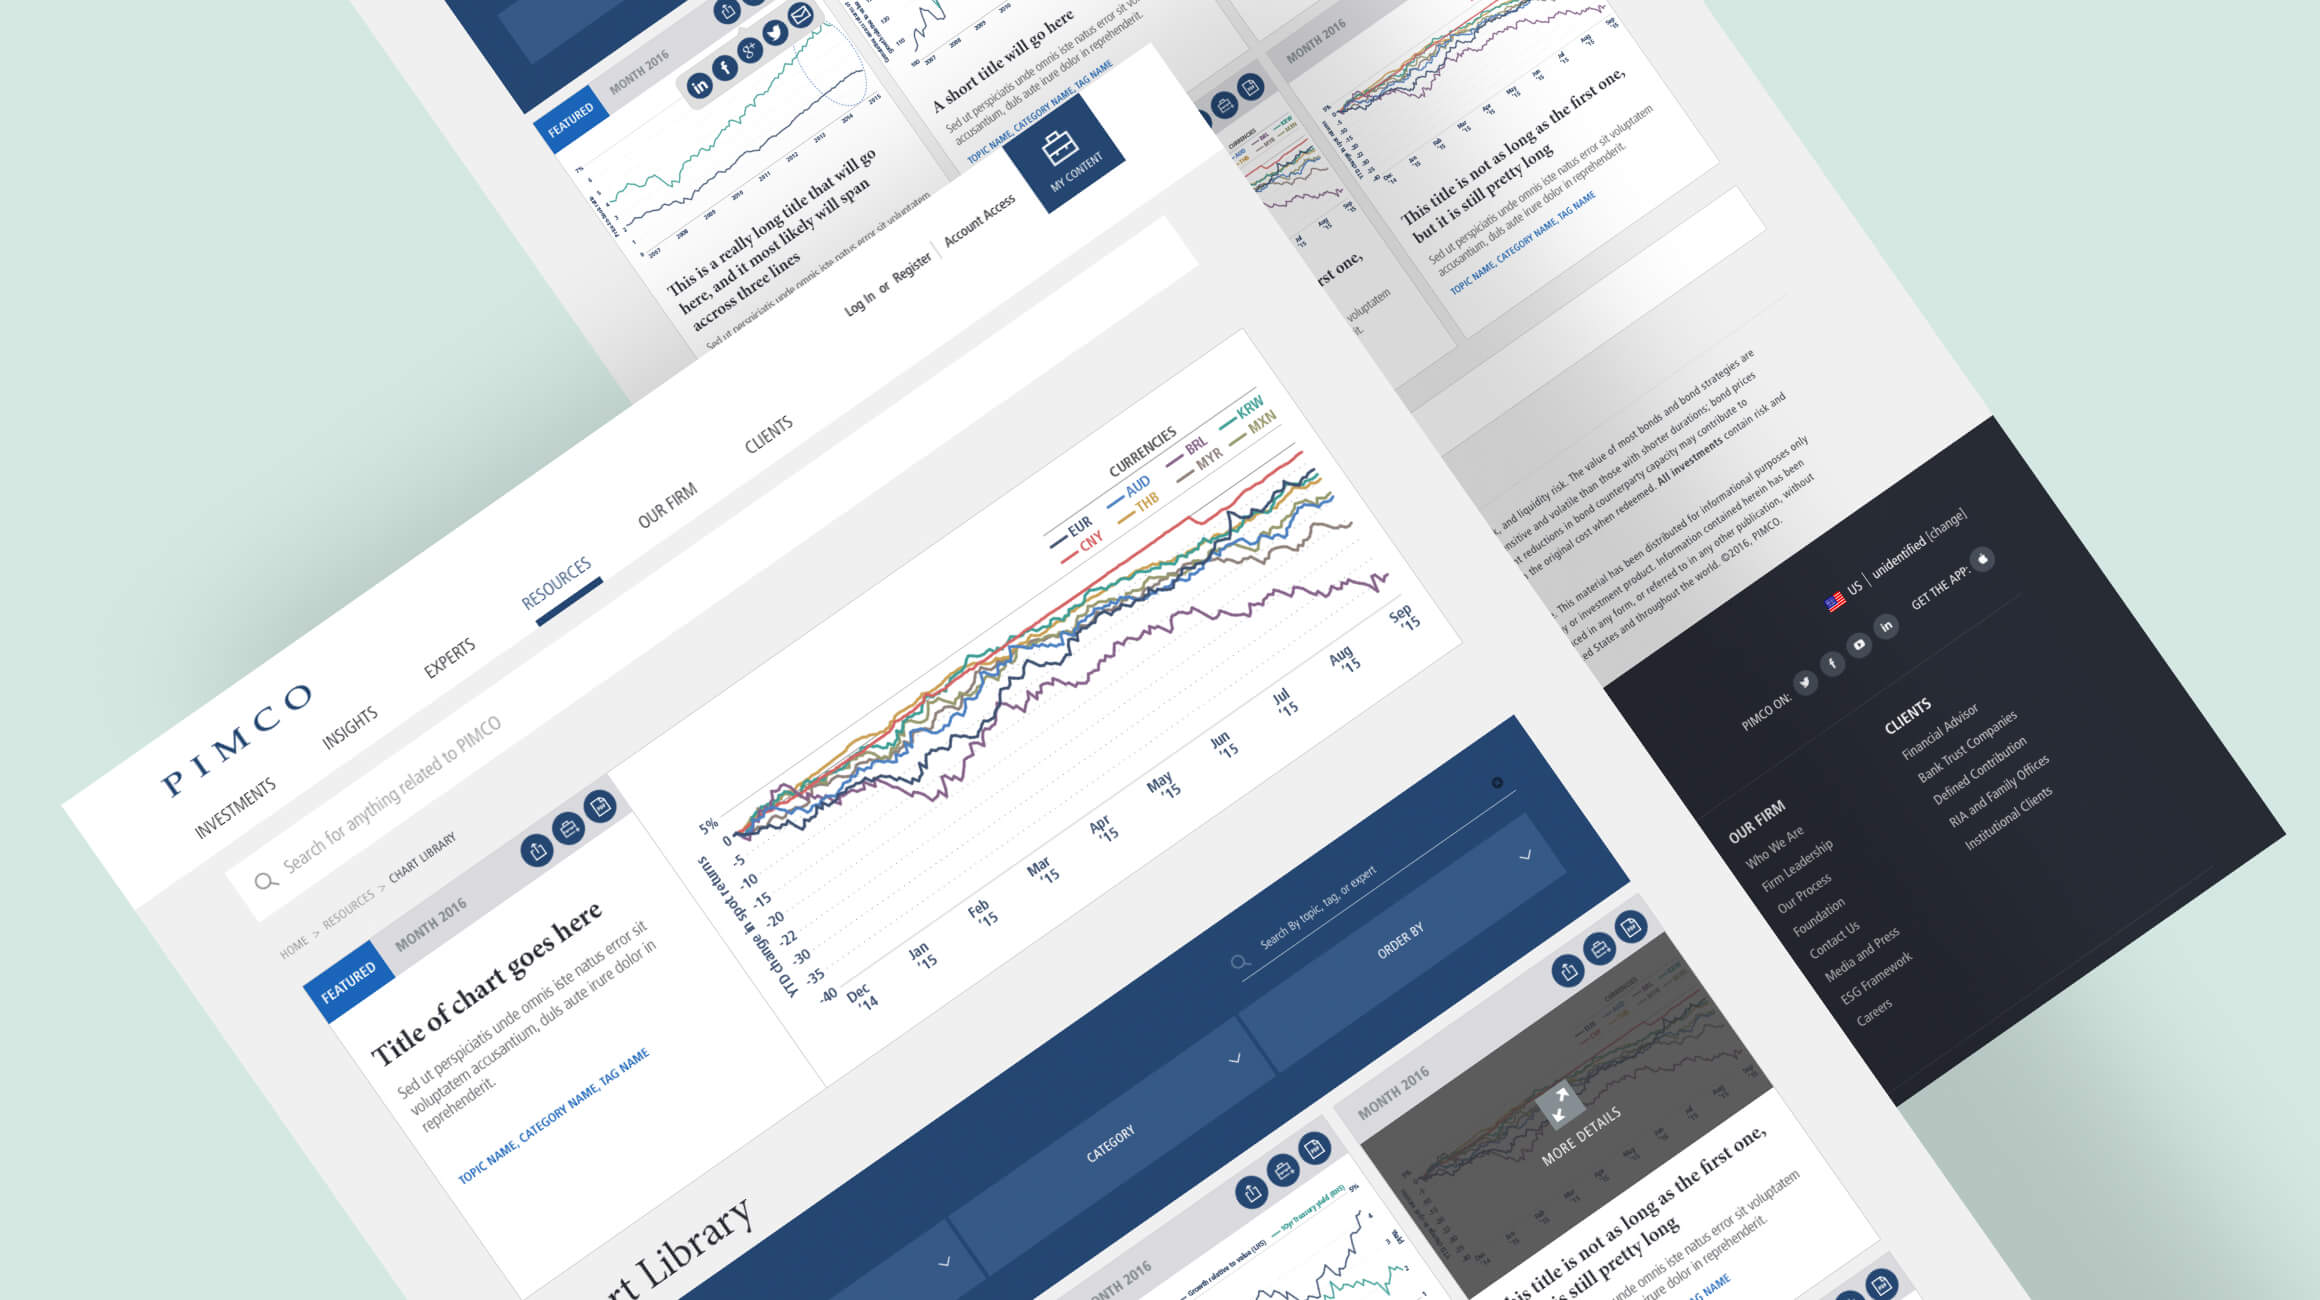
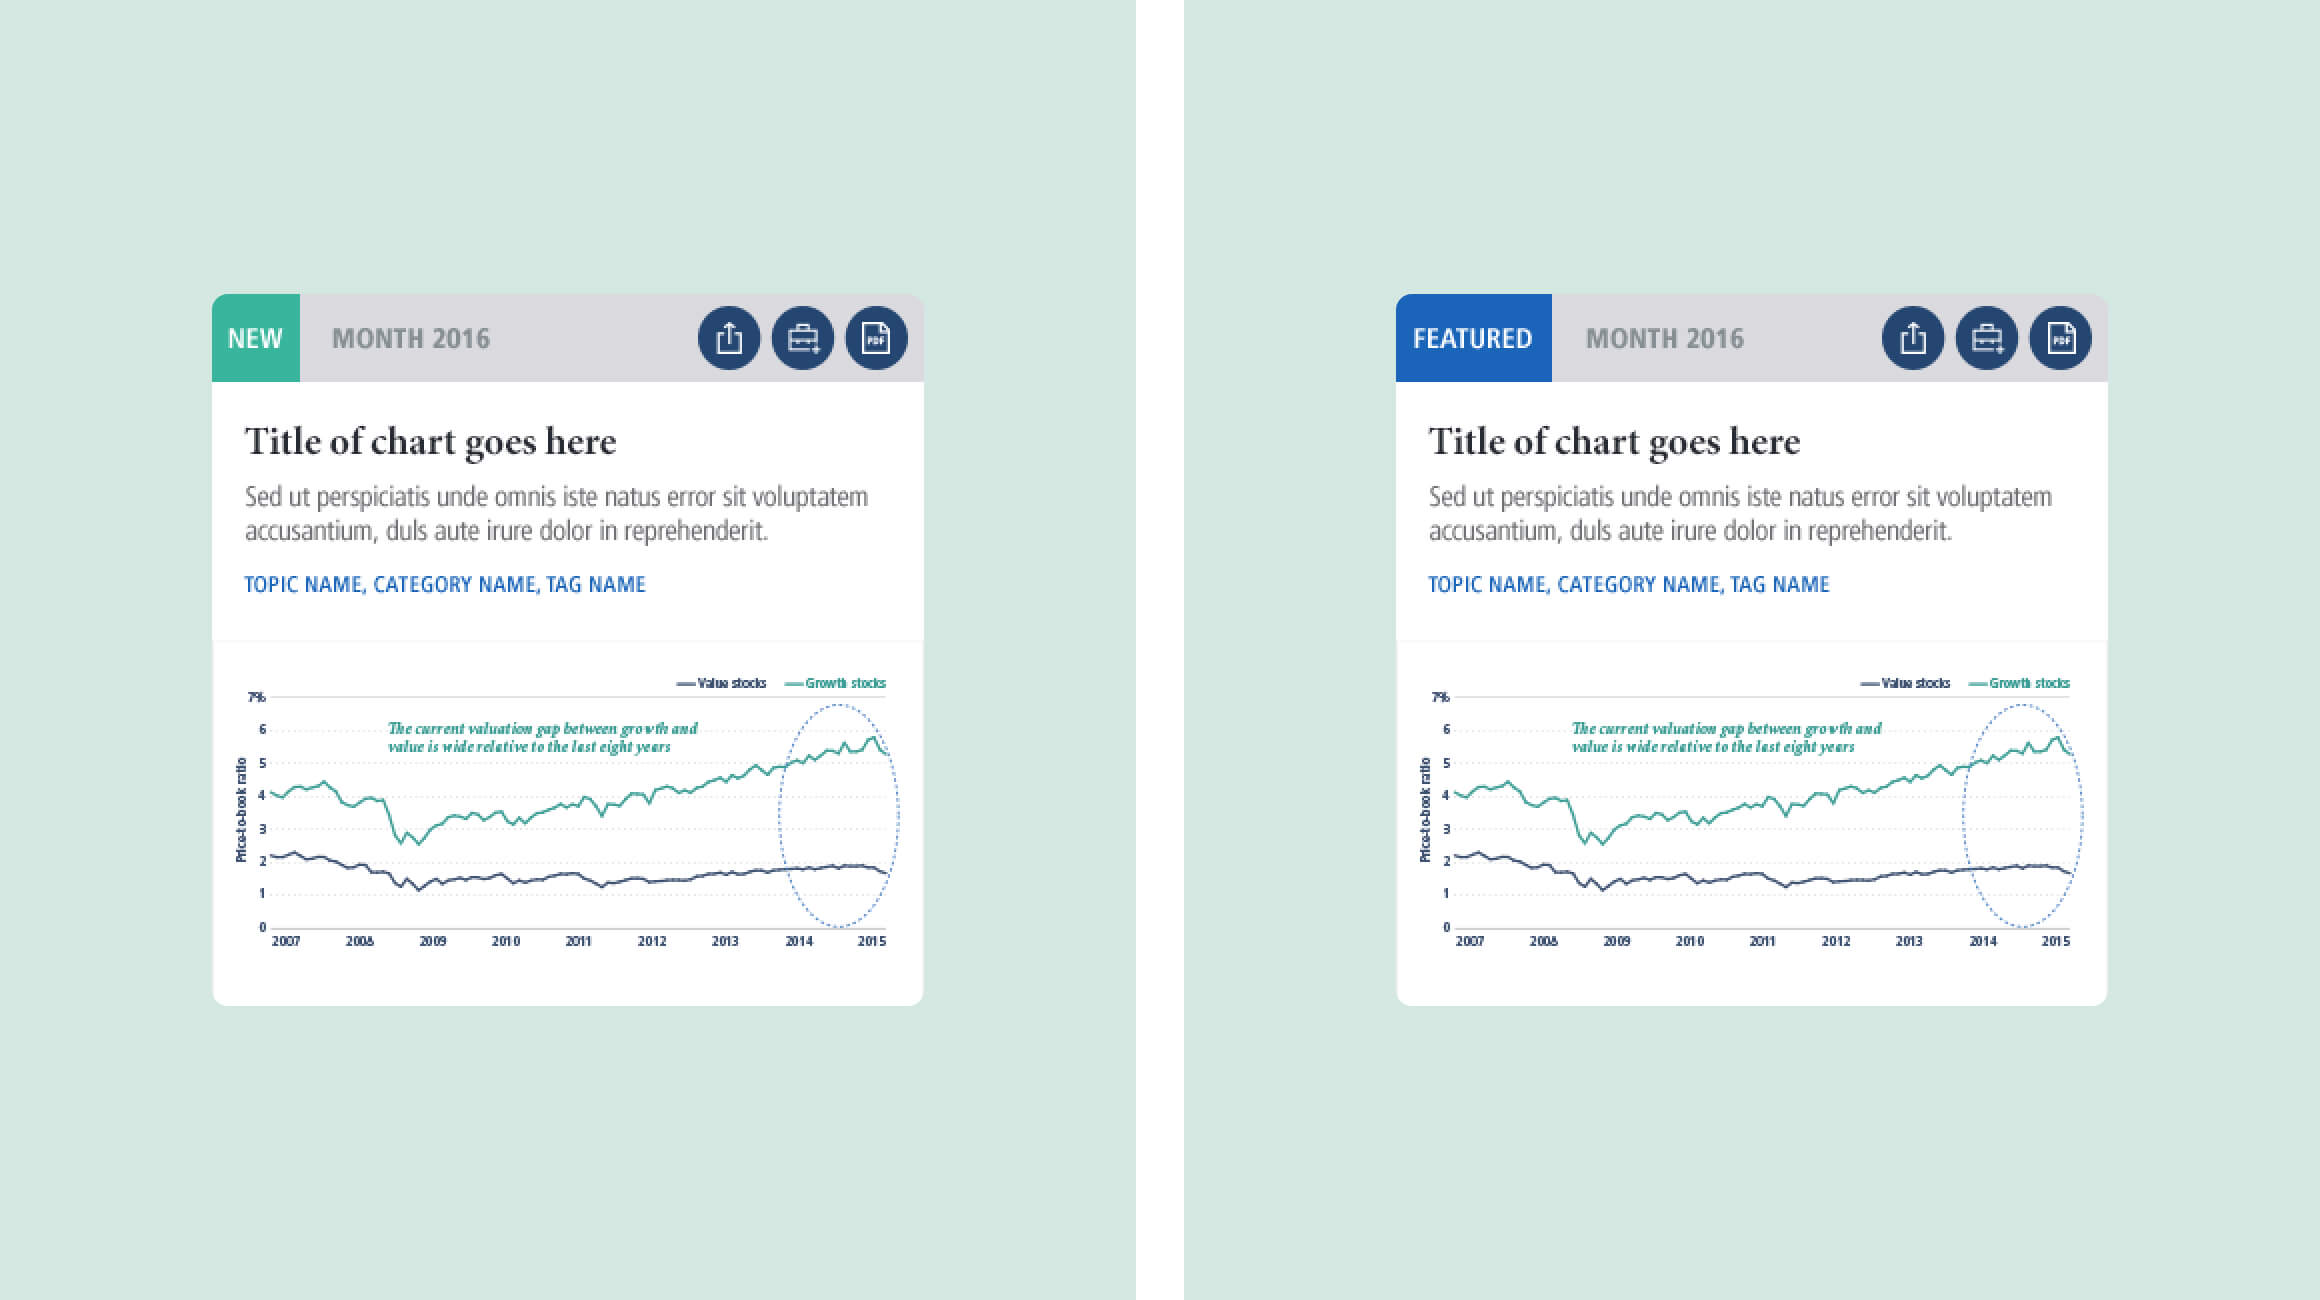
PIMCO developed a new feature named “Smart Charts,” designed to enable clients to access and utilize Pimco’s data and charts. This tool aimed to simplify chart selection, integrate a function for users to add charts to their “my content” section, provide options for sharing charts on social media, and highlight charts that are either new or featured.
My role
As the Senior Visual Designer, my role involved not only designing but also ensuring these designs were thoroughly documented and efficiently developed. This process required constant communication and coordination with each team member to align our efforts with project timelines and objectives. I also collaborated intensively with a diverse team comprising stakeholders, developers, project managers, and the product owner.
Solutions
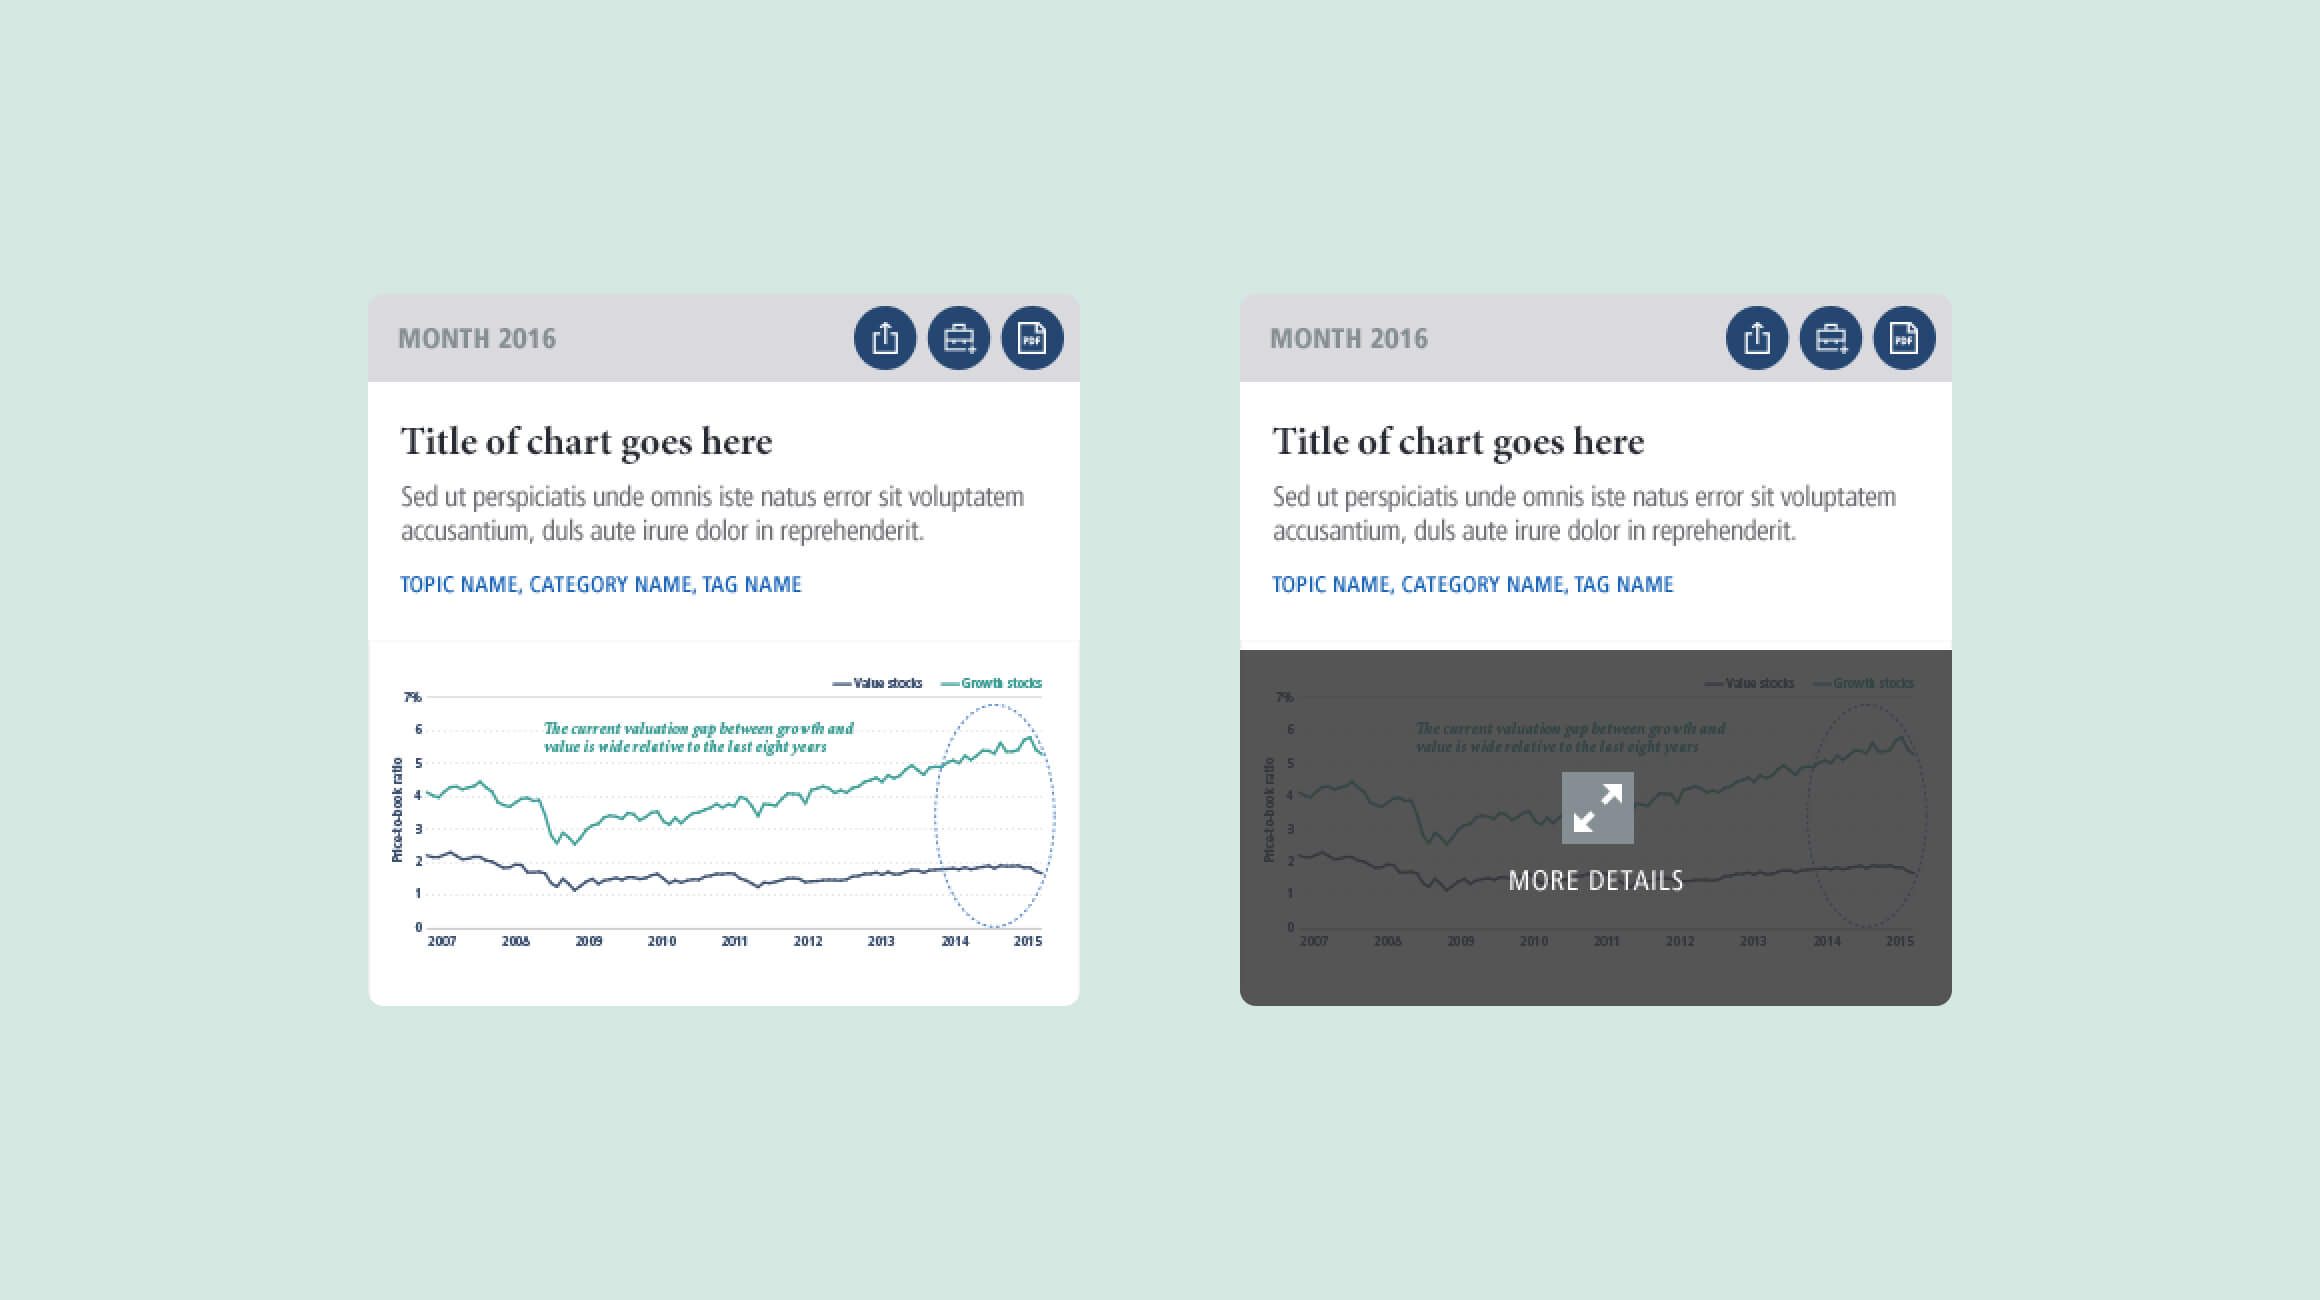
When I begin designing a user interface, my approach is to start with smaller components and gradually build upon them. For this project, I decided to use card layouts. This design choice helps users distinguish between different charts with ease, and it also supports effective filtering and sorting of the content.
Layout
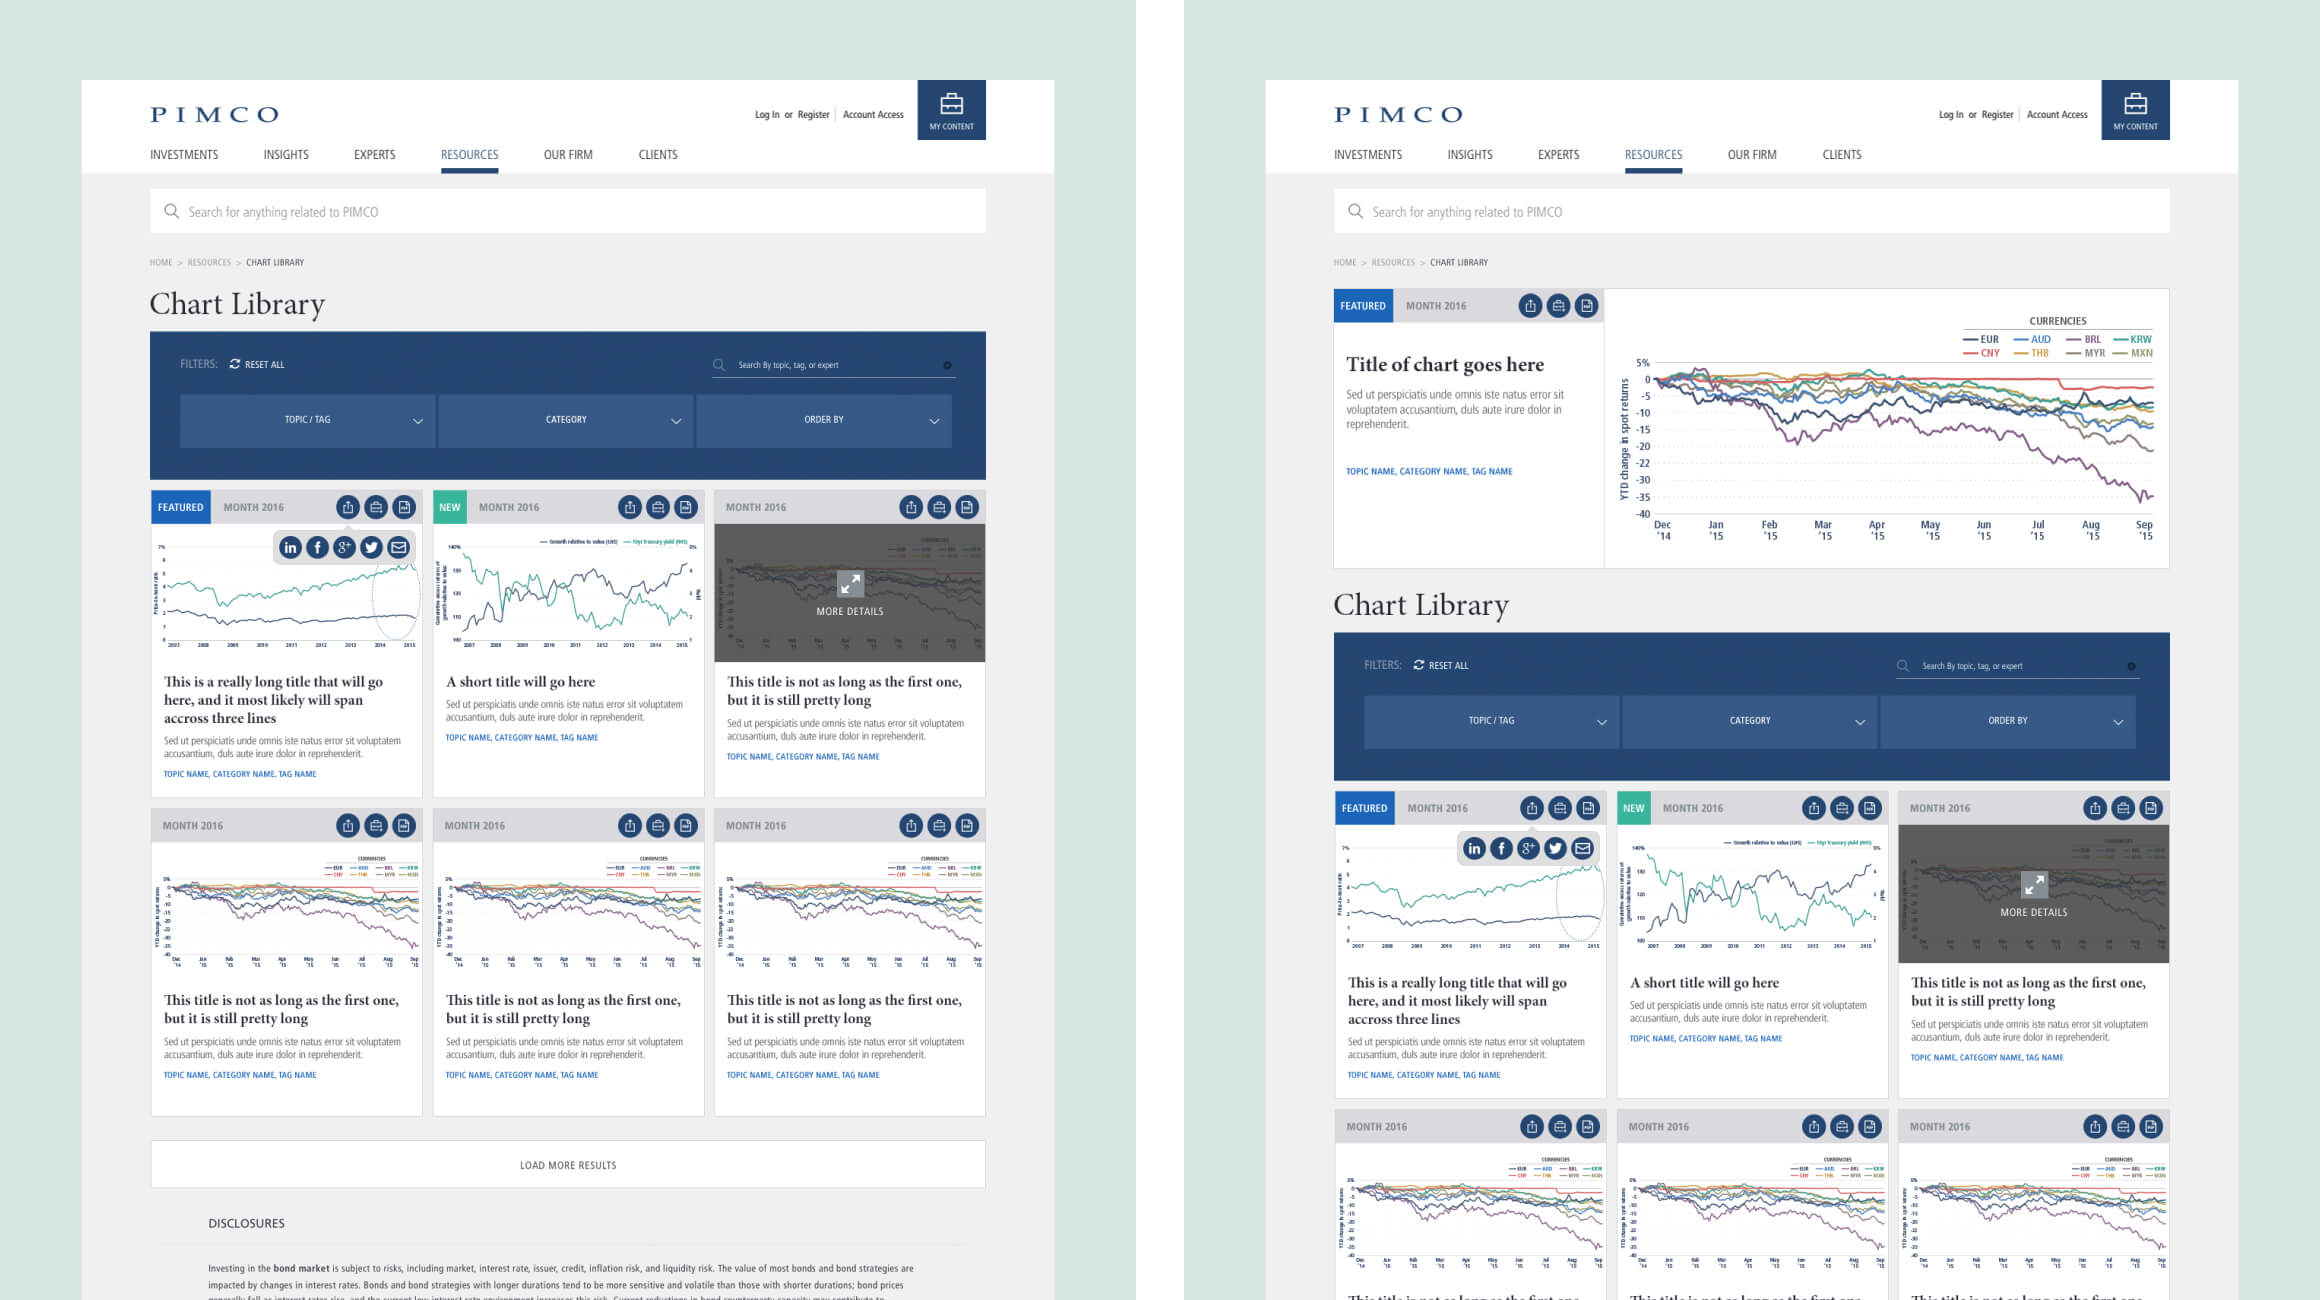
After finalizing the card design, I presented it to the stakeholders for their approval. Once it was approved, I proceeded to plan out how the cards would be displayed on the page. At this stage, stakeholders also emphasized the importance of prominently displaying a featured card, leading me to develop a solution to address this specific business requirement.

Interactions
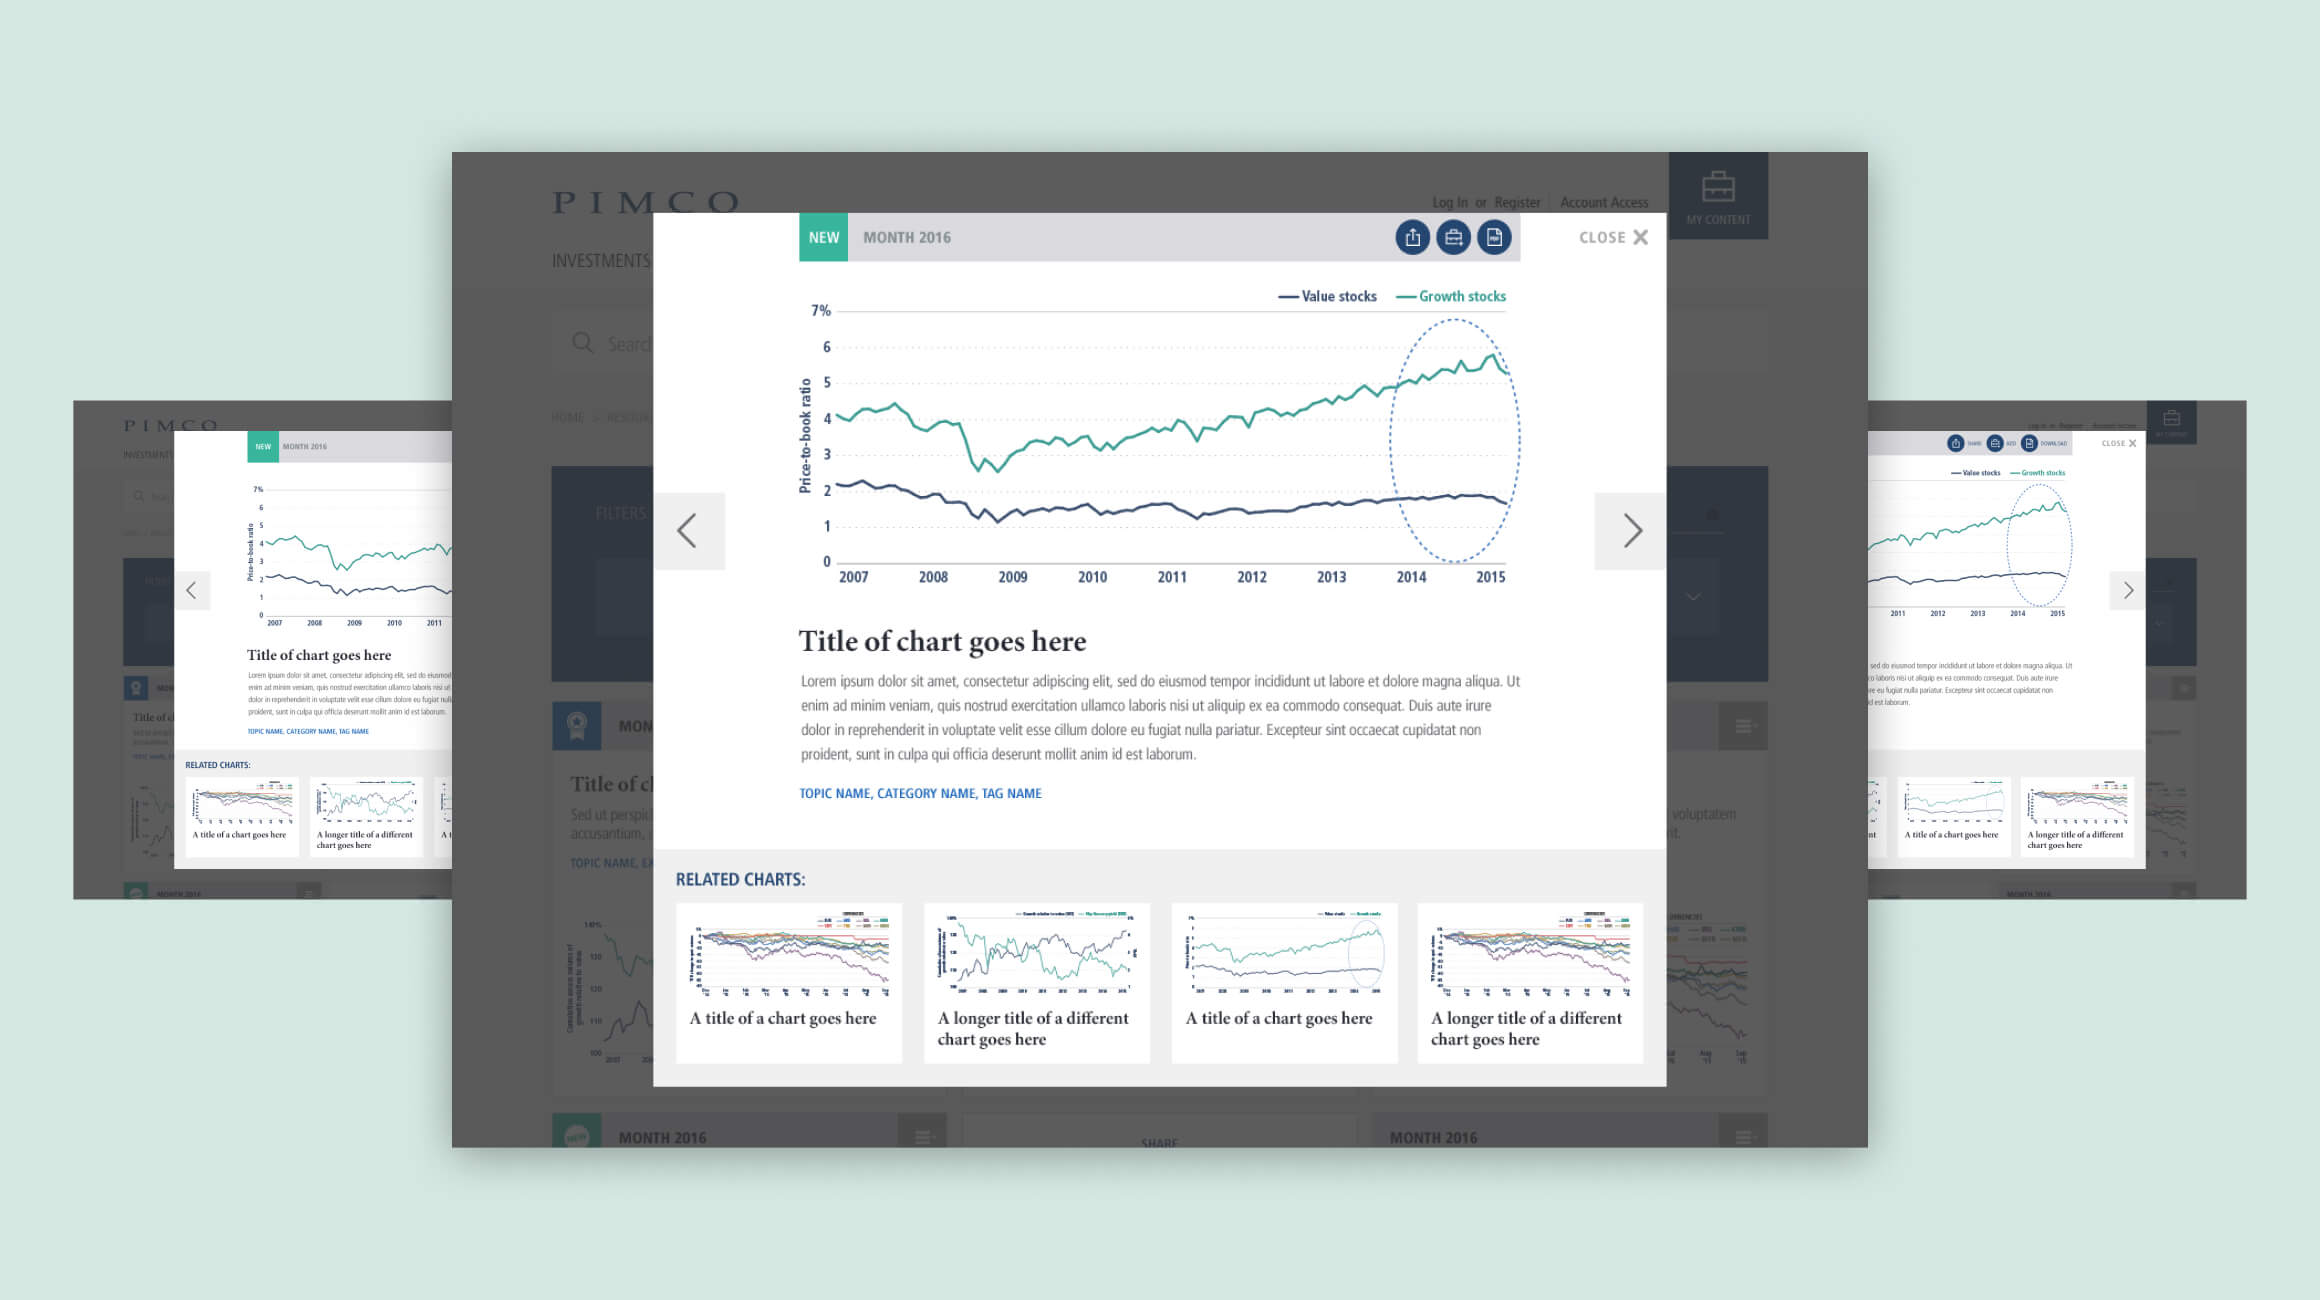
Now it’s time to focus on user interactions. When a user selects a chart to view, its details are displayed in a modal. This design choice ensures that the user can access the information without navigating away from the Smart Charts section. I have prepared three different versions of this modal for consideration.
Results
The stakeholders expressed high satisfaction with the final designs, appreciating both the aesthetics and functionality. Their positive feedback was a testament to the effectiveness of our collaborative approach. Overall, this project was a resounding success, demonstrating the power of teamwork and meticulous project management in achieving outstanding results.
